
Infographics and graphical abstract
Infographics and graphical abstract
Visual communication is an effective way to communicate scientific findings by making complex information easier to understand and remember. It highlights the key messages, increases engagement, and enhances the accessibility and impact of research.
Recognising the growing demand for high-quality visual communication, IHE has developed strong expertise in transforming complex scientific evidence into clear and engaging visual formats. We can produce visual communication materials tailored to our clients’ needs, either following IHE’s visual identity or adapted to the client’s branding.
Examples of visual communication materials include:
Infographics – Visual summaries that combine concise text, graphics, icons, illustrations, and data visualisations to communicate complex information in a clear and engaging way. They can serve as a standalone communication tool or complement more extensive scientific reports by highlighting key findings and making evidence more accessible to diverse audiences. Infographics can be designed in a variety of formats and optimised for print, presentations, websites, email, or social media.
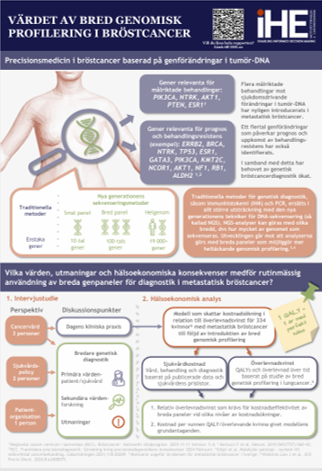
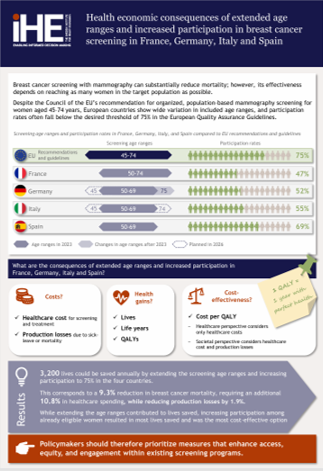
Graphical abstracts – A compact infographic designed to summarise the key findings of a scientific article. They complement traditional abstracts and are increasingly recommended by scientific journals to improve the visibility and communication of research.